- Looker Studio
- Reporting
- Dashboards
- GA4
What Is Looker Studio? A Marketing Dashboard Guide
By Dolphin Analytics team · Published 3 Sept 2026
TL;DR
Looker Studio is Google's free tool for building shareable dashboards, formerly called Google Data Studio. It connects to GA4, Google Ads, Search Console, Google Sheets and BigQuery for free, and to Meta or LinkedIn through paid third-party connectors. We build and automate this reporting for agency and in-house clients, so the manual upkeep stops being your job.
Olamide Sule, founder of Dolphin Analytics: a digital analytics expert based in London delivering solutions for agency and in-house clients.
We build Looker Studio marketing dashboards for clients, and we set up and fix the GA4 and GTM tracking that feeds them for agency and in-house teams most weeks. Plenty of the dashboards we inherit have quietly stopped being trustworthy, and we rebuild those too. This is the walkthrough we give a marketer who wants to know what Looker Studio is, whether it fits their reporting, and where it will bite them later. It covers what the tool does, what it connects to, how to build a marketing dashboard in it step by step, and the limits worth knowing before you commit a reporting process to it.
What is Looker Studio?
Looker Studio is Google’s free data visualisation and dashboarding tool. It pulls data from sources such as GA4 (Google Analytics 4), Google Ads and Search Console, then turns them into shareable, interactive reports built from charts, tables and scorecards. Google renamed it from Google Data Studio in 2022; the tool is the same, only the name changed, which is why older guides and some search results still say “Data Studio”.
The appeal is simple. A report in Looker Studio updates itself from the connected data, so once it’s built, viewers see live numbers instead of a static export. You share it with a link, the way you share a Google Doc, and readers can change the date range or filter to a campaign without touching the underlying setup. For marketing teams and agencies, that makes it the default free option for client reports and channel dashboards.
Is Looker Studio free, or does it cost money?
The core Looker Studio product is free, with no cap on the number of reports you build or the people who view them. Google also sells Looker Studio Pro, a paid tier that adds team asset management, Google Cloud project support and service-level support, charged as a per-user monthly fee. Most marketing teams run the free version and never need Pro.
The real cost sits elsewhere, and the “free” label hides it: paid connectors for non-Google platforms, and the hours someone spends keeping each report accurate. More on both below.
What data can a Looker Studio marketing dashboard pull in?
Looker Studio connects to data through connectors, and the split between free and paid ones decides most of your setup. Google’s own connectors for GA4, Google Ads, Search Console, Google Sheets, YouTube and BigQuery are built in and free. Data from non-Google platforms like Meta Ads, LinkedIn Ads or TikTok needs a third-party connector, and most of those are paid subscriptions from partners such as Supermetrics.
You can also combine sources into a single chart with a blend, which joins two or more data sources on a shared key such as Date. Blends are how you put Google Ads spend next to GA4 conversions in one table. They have limits, though: Looker Studio caps how many sources one blend can join, and heavily blended reports get slow to load (see Google’s Looker Studio documentation). Plan the dashboard around a few clean sources rather than blending everything into one giant view.
How do you build a marketing dashboard in Looker Studio?
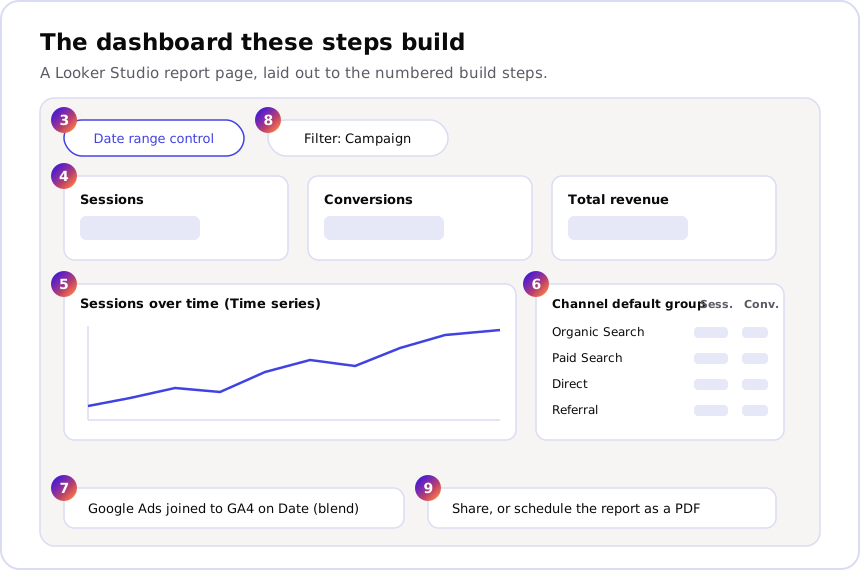
Here is the sequence we follow for a basic GA4 and Google Ads marketing dashboard. Every step is a real action in the Looker Studio interface.
- Go to lookerstudio.google.com and click Create, then Report.
- In the “Add data to report” panel, choose the Google Analytics connector, authorise access, and select your GA4 property. It becomes the report’s first data source.
- Add a date control so viewers can change the period: Insert > Date range control, then drag it to the top of the page.
- Add headline numbers with scorecards: Insert > Scorecard, then set the metric in the Setup panel on the right (for example Sessions, Conversions, Total revenue). Repeat for each KPI you want on the top row.
- Add a trend chart: Insert > Time series, set the dimension to Date and the metric to Sessions or Conversions.
- Add a channel breakdown: Insert > Table, set the dimension to Session default channel group, add Sessions and Conversions as metrics, then sort the table by Conversions.
- Bring in Google Ads: Resource > Manage added data sources > Add a data source > Google Ads. To show ad spend next to GA4 conversions on one chart, open Resource > Manage blends and join the two sources on Date.
- Add a filter viewers can use: Insert > Drop-down list control, then set the control’s dimension to something like Campaign or Device.
- Share or schedule: click Share to set who can view or edit, or Share > Schedule delivery to email the report as a PDF on a set cadence.
That gives you a working dashboard. Keeping it accurate month after month is the part these steps don’t show, and it’s where most reporting setups quietly fall over.
What are Looker Studio’s limits for marketing reporting?
Looker Studio is a strong visualisation tool, but it is only ever as good as the data fed into it, and it does nothing to check that data. These are the limits that matter once a dashboard becomes something a client or a board relies on.
- It validates nothing. Looker Studio shows whatever the connector sends. A double-counted purchase event, a connector that stopped syncing last Tuesday, a metric mapped to the wrong field: each renders as a clean, confident number that looks exactly like a correct one.
- Blends are capped and slow. Joining many sources into one view hits the blend source limit, and page load times climb as the report grows.
- Someone maintains it by hand. Connectors break after platform API changes, GA4 dimensions get renamed, and every new campaign or channel needs a new filter or field. Each dashboard is a standing maintenance job, not a build-once asset.
- Paid connectors add up. Third-party connector subscriptions for Meta, LinkedIn, TikTok and the rest are a recurring cost that the “free” headline hides.
- It reports platform claims, not reconciled truth. A Meta Ads connector shows Meta’s numbers, which routinely overstate what the store actually recorded. Looker Studio will happily chart the inflated figure.
When we audit reporting setups, the fault we find most is not an ugly chart. It’s a dashboard everyone trusts that has been wrong for months, because nothing in Looker Studio compares the numbers against the source. A neat report is not the same as a correct one, and the tool cannot tell you which you have.
Looker Studio vs Looker: what’s the difference?
Looker Studio and Looker are two different Google products with a confusing shared name. Looker Studio is the free, self-serve dashboard tool this guide describes. Looker is a separate, paid enterprise business-intelligence platform on Google Cloud, built around a modelling layer (LookML) that governs how a whole company defines its metrics. Looker suits large data teams that need one governed definition of “revenue” across the business; Looker Studio suits marketers who want a dashboard today. Most marketing teams want Looker Studio.
Where the manual work stops being your job
We build Looker Studio dashboards, and we automate the reporting behind them so the numbers stay right without a person babysitting them. For a ski travel company, we built their Looker Studio dashboards from scratch in two weeks, ready for Black Friday. Where the manual upkeep is the real pain, we pull data straight from the platform APIs and generate validated reports instead, an approach we cover on our reporting page. If you’re choosing the tool underneath the dashboard in the first place, our guide to digital analytics tools and the one on GA4 sessions and events both feed into what a marketing dashboard should actually show.
If reporting is eating your week, talking to us is a place to describe the problem and get a considered reply from a person. No booking form, no sales call: tell us what’s broken about your reporting and we’ll give you an honest read on it.
Frequently asked
What is Looker Studio used for?
Looker Studio is used to turn marketing data into shareable, interactive dashboards. It connects to sources like GA4, Google Ads and Search Console, then displays them as charts, tables and scorecards that viewers can filter and re-date. Marketers and agencies use it for client reports, campaign dashboards and channel performance views.
Is Looker Studio free?
The core Looker Studio product is free, with no limit on the number of reports or viewers. Google also sells Looker Studio Pro, a paid tier that adds team asset management and support for a per-user monthly fee. The hidden costs are elsewhere: paid third-party connectors for non-Google platforms, and the time someone spends maintaining each dashboard.
What is the difference between Looker and Looker Studio?
Looker Studio is Google's free, self-serve dashboard tool. Looker is a separate, paid enterprise business-intelligence platform on Google Cloud, built around a modelling layer (LookML) for governed, company-wide data. They share a name and a vendor, but they are different products for different jobs; most marketing teams want Looker Studio, not Looker.
What are the limitations of Looker Studio for marketing reports?
Looker Studio validates nothing, so a double-counted conversion or a connector that silently stopped syncing looks exactly like a correct number. Blends are capped in how many sources they join and slow down as they grow, non-Google connectors are a recurring paid cost, and every dashboard is a standing maintenance job when APIs and GA4 dimensions change.
Should I build a Looker Studio dashboard myself or get help?
Build it yourself if the data is one or two Google sources and the reporting is simple; Looker Studio is free and the basics are quick to learn. Get help once the dashboard spans many platforms, the numbers need to be trusted by a board or a client, or maintaining it is eating real time. We build Looker Studio dashboards and automate the reporting behind them for agency and in-house teams.