- GA4
- DebugView
- Tracking
- Troubleshooting
GA4 DebugView Not Working? Why Events Won't Show
By Dolphin Analytics team · Published 8 Sept 2026
TL;DR
An empty GA4 DebugView usually means debug mode is off, not that tracking is broken. DebugView only shows sessions you flag for debugging, so a normal visit never appears. Switch it on with an extension, GTM Preview, or a debug_mode parameter, then reload. If events still miss, the tag is not firing or something downstream is blocking it. We fix broken GA4 setups for clients most weeks.
Olamide Sule, founder of Dolphin Analytics: a digital analytics expert based in London delivering solutions for agency and in-house clients.
An empty GA4 (Google Analytics 4) DebugView sends most people looking for a broken tag. Usually the tag is fine and DebugView is doing exactly what it should. We set up and fix GA4 tracking for agencies and in-house teams every week, and the same first question sorts nearly every case: is debug mode actually on for the session you are watching?
Why is your GA4 DebugView empty?
DebugView only shows events from a session you have flagged for debugging, so a normal visit never appears in it. DebugView is the GA4 report that streams events from a single debug device in near real time, which makes it perfect for testing and useless as a general traffic view. If you open it expecting to see live visitors, you will see nothing, and nothing is the correct answer.
That design trips up most “DebugView not working” searches. The report is empty not because tracking failed, but because no session is currently in debug mode. Switch debug mode on for your own device, reload the page, and your events start arriving. If they still do not, then you have a real tracking fault, and the rest of this guide works through it in order.
How do you turn on debug mode for DebugView?
There are three ways to put a session into debug mode, and any one of them makes your device appear in DebugView. Pick whichever matches how your GA4 tag is deployed.
- The Google Analytics Debugger extension. Install the Google Analytics Debugger Chrome extension, click its icon so it reads ON, then reload the page. This flags every hit from that browser tab as debug traffic. Good for a hard-coded gtag setup where you are not using Tag Manager.
- GTM Preview mode. In your GTM workspace, click Preview at the top right, enter your site URL in Tag Assistant, and click Connect. Tag Assistant flags the session for debugging automatically, so your GA4 events appear in DebugView while Preview is connected. This is the route to use whenever GA4 is deployed through Google Tag Manager.
- A debug_mode parameter. Set
debug_mode: trueon the GA4 Configuration tag in GTM (add a field nameddebug_modewith valuetrue), or passdebug_mode: truein your gtag config call. Useful when you want a specific environment, like staging, always visible in DebugView without an extension.
Then open Admin, then DebugView (listed under Data display) in the GA4 property you expect the data to land in. Your device shows in the top-left selector once any of the above is active, and events stream in as you click around the site.
Why is DebugView still not showing events with debug mode on?
If debug mode is on and DebugView is still empty, the hit is not reaching GA4, and the fault sits in one of five places. Work through them in this order, because the earlier causes are far more common than the later ones.
| Cause | What is happening | How to confirm it |
|---|---|---|
| The GA4 tag is not firing | No hit leaves the page at all | Check GTM Preview or Tag Assistant: the GA4 tag should sit under Tags Fired |
| Wrong Measurement ID | Hits fire into a different property | Compare the ID on the tag against Admin, then Data Streams (it starts with G-) |
| Consent Mode is holding the tag | The tag waits for a consent signal that never comes | Check whether analytics_storage is denied and the tag is set to wait for consent |
| A data filter is excluding you | An internal traffic or developer filter drops the hit | Check Admin, then Data Streams, then Configure tag settings for internal traffic rules |
| An ad blocker or the wrong device | The request is blocked or you are testing on a different device than the one in debug | Disable blockers for the test, and confirm the debug device matches the one selected in DebugView |
The GA4 tag is not firing at all
The most common reason DebugView stays empty is that the GA4 tag never fires, so there is no hit to debug. Open GTM Preview or the Tag Assistant extension and load the page: the GA4 Configuration or Event tag should appear under Tags Fired. If it sits under Tags Not Fired, the problem is a trigger, and no DebugView setting will change that. Our companion guide on GTM tags that will not fire walks through the trigger checks.
The hit is firing into the wrong property
A tag can fire perfectly and still miss your DebugView because it is sending hits to a different property. Read the Measurement ID on the live tag, then compare it against Admin, then Data Streams in the property you are watching. A leftover ID from a staging build, a rebuild, or a copied container is a frequent culprit, and it explains the case where DebugView works in one property but not the one you expected.
Consent Mode is holding the tag back
With Google Consent Mode active, a GA4 tag can be set to wait until
analytics_storage is granted. If your test session never grants consent, the
tag holds, and DebugView shows nothing even though the tag is present and
correct. Interact with your own consent banner to grant analytics consent, then
reload, and watch the events arrive. If they do, consent handling is your real
issue, not DebugView.
DebugView, Realtime, or Tag Assistant: which should you use?
These three tools answer different questions, and reaching for the wrong one wastes time. DebugView shows the exact event stream, with parameters, for a single debug device, so it is the tool for verifying that events fire correctly and carry the right data. The Realtime report shows aggregated activity across all live users, which is better for a quick “is anything arriving at all” check. Tag Assistant and GTM Preview sit one layer earlier: they prove whether the tag fired in the browser, before GA4 has accepted or rejected the hit.
A tag that fires in Tag Assistant but never lands in DebugView is the classic sign that the browser sent the request and GA4 refused it, usually for a wrong Measurement ID or a consent block. If you want to confirm the GA4 tag is even present on a page before you open GA4 at all, Sonar checks that from the outside, the way a visitor’s browser sees your site. A DebugView showing zero events sits alongside the broader case of GA4 showing no data at all, where the same tag-first logic applies.
How we use DebugView on an audit
DebugView is where we catch faults that standard reports hide, because it lists every event and its parameters as they arrive. Here is what that looked like on one agency engagement. Working through a marketing agency, across a 16-hotel group we found duplicate purchase events inflating booking counts, plus untagged booking subdomains and a failing tag container. It gave them their first accurate property-level view of direct bookings. A duplicated purchase like that is invisible in a monthly report and obvious in DebugView: you watch one test checkout and see the purchase event land twice.
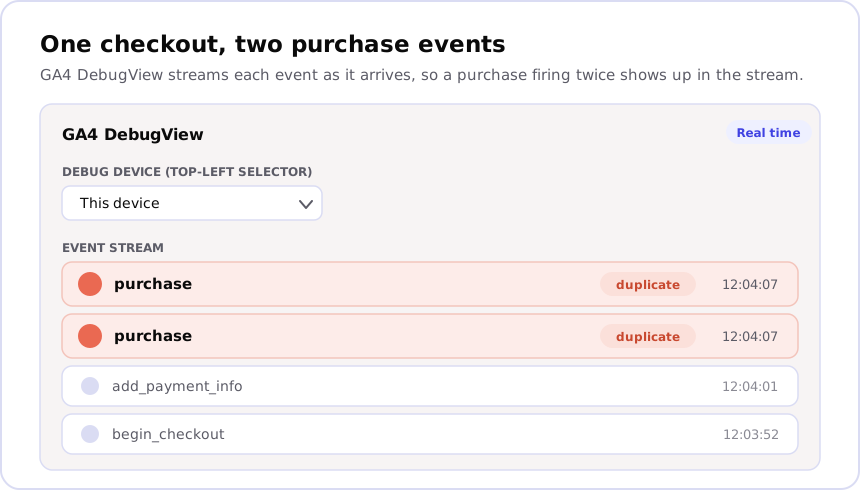
When we audit an account, walking a single journey through DebugView is one of the first checks we run, and it routinely surfaces events firing twice, firing early, or carrying the wrong values.
If your DebugView is empty and the steps above have not fixed it, the tagging underneath is worth a proper look. Tell us what’s broken, or book a call, and we will help you work out whether it is a quick trigger fix or a deeper tracking problem.
FAQ
Why is my GA4 DebugView not showing events? DebugView only shows events from sessions flagged for debugging, not from normal traffic, so an empty DebugView usually means debug mode is off. Switch it on with the Google Analytics Debugger extension, GTM Preview, or a debug_mode parameter, then reload. If events still miss once debug mode is active, the GA4 tag itself is not firing on that page.
How do I enable debug mode for GA4 DebugView?
Install the Google Analytics Debugger Chrome extension and toggle it ON, or open
GTM Preview and connect Tag Assistant, or set debug_mode: true on the GA4
Configuration tag. Any one of these makes your device appear under Admin, then
DebugView.
Why does GTM Preview work but DebugView is empty? A tag firing in Preview only proves GTM sent the request, not that GA4 accepted it. Check the Measurement ID against Admin, then Data Streams, and check whether Consent Mode is holding the tag until analytics consent is granted.
How long does GA4 DebugView take to show events? DebugView is close to real time, so events appear within a few seconds once debug mode is on. If nothing shows after you reload with debug mode active, treat it as a fault, not a delay.
Can DebugView show duplicate or wrong events? Yes. Because it lists each event as it arrives, a purchase firing twice or an event carrying the wrong parameters shows up plainly, which is how we catch these faults during an audit before they distort standard reports.
Frequently asked
Why is my GA4 DebugView not showing events?
DebugView only shows events from sessions flagged for debugging, not from normal traffic, so an empty DebugView usually means debug mode is off. Switch it on with the Google Analytics Debugger Chrome extension, GTM Preview mode, or a debug_mode parameter on the tag, then reload your site. If events still do not appear once debug mode is active, the GA4 tag itself is not firing on that page, and Tag Assistant or the Realtime report will confirm it.
How do I enable debug mode for GA4 DebugView?
There are three ways. Install the Google Analytics Debugger Chrome extension, click its icon to turn it ON, then reload the page. Or open GTM, click Preview, connect Tag Assistant to your site, which flags the session for debugging automatically. Or set debug_mode to true on the GA4 Configuration tag or in your gtag config. Any one of these makes your device appear in GA4 under Admin, then DebugView.
Why does GTM Preview work but DebugView is empty?
A tag firing in GTM Preview only proves the container sent the request; it does not prove GA4 accepted it. The usual causes are the wrong Measurement ID, so hits land in a different property, or Consent Mode holding the tag until consent is granted. Check the Measurement ID on the tag against Admin, then Data Streams, and check whether the tag waits on a consent signal that never fires in your test.
How long does GA4 DebugView take to show events?
DebugView is close to real time, so events appear within a few seconds of the action once debug mode is on. It is near real time, not the delayed processing of standard reports. If nothing shows after you reload the page with debug mode active, treat it as a fault, not a delay: the tag is not firing, or something downstream is blocking the hit.
Can DebugView show duplicate or wrong events?
Yes, and that is one of its most useful jobs. Because DebugView lists each event as it arrives, a purchase firing twice on one checkout, or an event carrying the wrong parameters, shows up plainly in the stream. Watching a single test journey through DebugView is how we catch duplicate and malformed events during an audit, before they inflate the numbers in standard reports.