
How to Set Up Customer Journey Tracking: Step-by-Step Guide
Analytics Strategy
Learn how to effectively set up customer journey tracking to enhance interactions, drive loyalty, and boost business growth.
Customer journey tracking helps you understand how customers interact with your brand at every stage, from discovering your business to becoming loyal advocates. Here’s how you can set it up:
Define Goals: Set measurable targets like improving conversion rates or increasing retention.
Identify Touchpoints: Map where customers interact with your brand (e.g., website, emails, stores).
Build Profiles: Use data like demographics, behaviours, and preferences to personalise experiences.
Set Up Tools: Use tools like Google Analytics 4 and Google Tag Manager to track interactions.
Map Journeys: Visualise customer paths to find drop-offs or opportunities for improvement.
Optimise: Analyse data to refine experiences, fix issues, and measure results.
Tracking helps you improve customer experiences, drive loyalty, and boost growth with informed decisions.
Understanding Your Customer Journey with Google Analytics 4
Prepare Your Tracking Plan
Set up a clear tracking strategy that aligns with your business objectives and gathers actionable insights.
Define Your Goals
Start by outlining clear, measurable goals for monitoring the customer journey. Focus on outcomes that directly contribute to business growth and improve ROI.
Here are some key metrics to consider:
Conversion rate improvements at specific stages of the journey
Reductions in customer acquisition costs
Increases in average order value
Growth in customer lifetime value
Higher retention rates
Make sure each goal has a defined target and timeline. For instance, "Increase checkout completion rate from 45% to 60% within three months" is far more actionable than a vague goal like "improve conversions."
List Customer Touchpoints
Identify every point where customers interact with your brand.
These touchpoints may include:
Digital channels: Website visits, email campaigns, social media interactions
Traditional marketing: TV ads, print media, outdoor displays
Direct communication: Phone calls, live chat, support tickets
In-person interactions: Store visits, events, product demonstrations
Post-purchase engagement: Delivery updates, feedback surveys, loyalty programmes
Create Customer Profiles
Detailed customer profiles allow you to focus on the most relevant interactions and behaviours.
"We always kept detailed notes on each customer, including the issues they had in the past and their needs/goals. Armed with this information, I was much better equipped to meet customers where they were and guide them to success." - Rami El-Abidin, Former HubSpot Support Team Member and Current Blog Writer
When creating these profiles, consider the following data categories:
Data Category | Key Elements to Track |
|---|---|
Demographic | Age, income, education, occupation |
Behavioural | Purchase history, browsing patterns, preferred channels |
Psychographic | Values, interests, lifestyle choices |
Geographic | Location, market preferences, regional needs |
A recent study revealed that 81% of customers favour companies that deliver personalised experiences.
With a solid tracking plan in place, you’re ready to set up tools that will help you gather these insights effectively.
Set Up Your Tools
Once your tracking plan is ready, it's time to set up the systems that will collect customer journey data. This step turns your plan into action, enabling accurate data collection.
Choose and Configure Analytics Tools
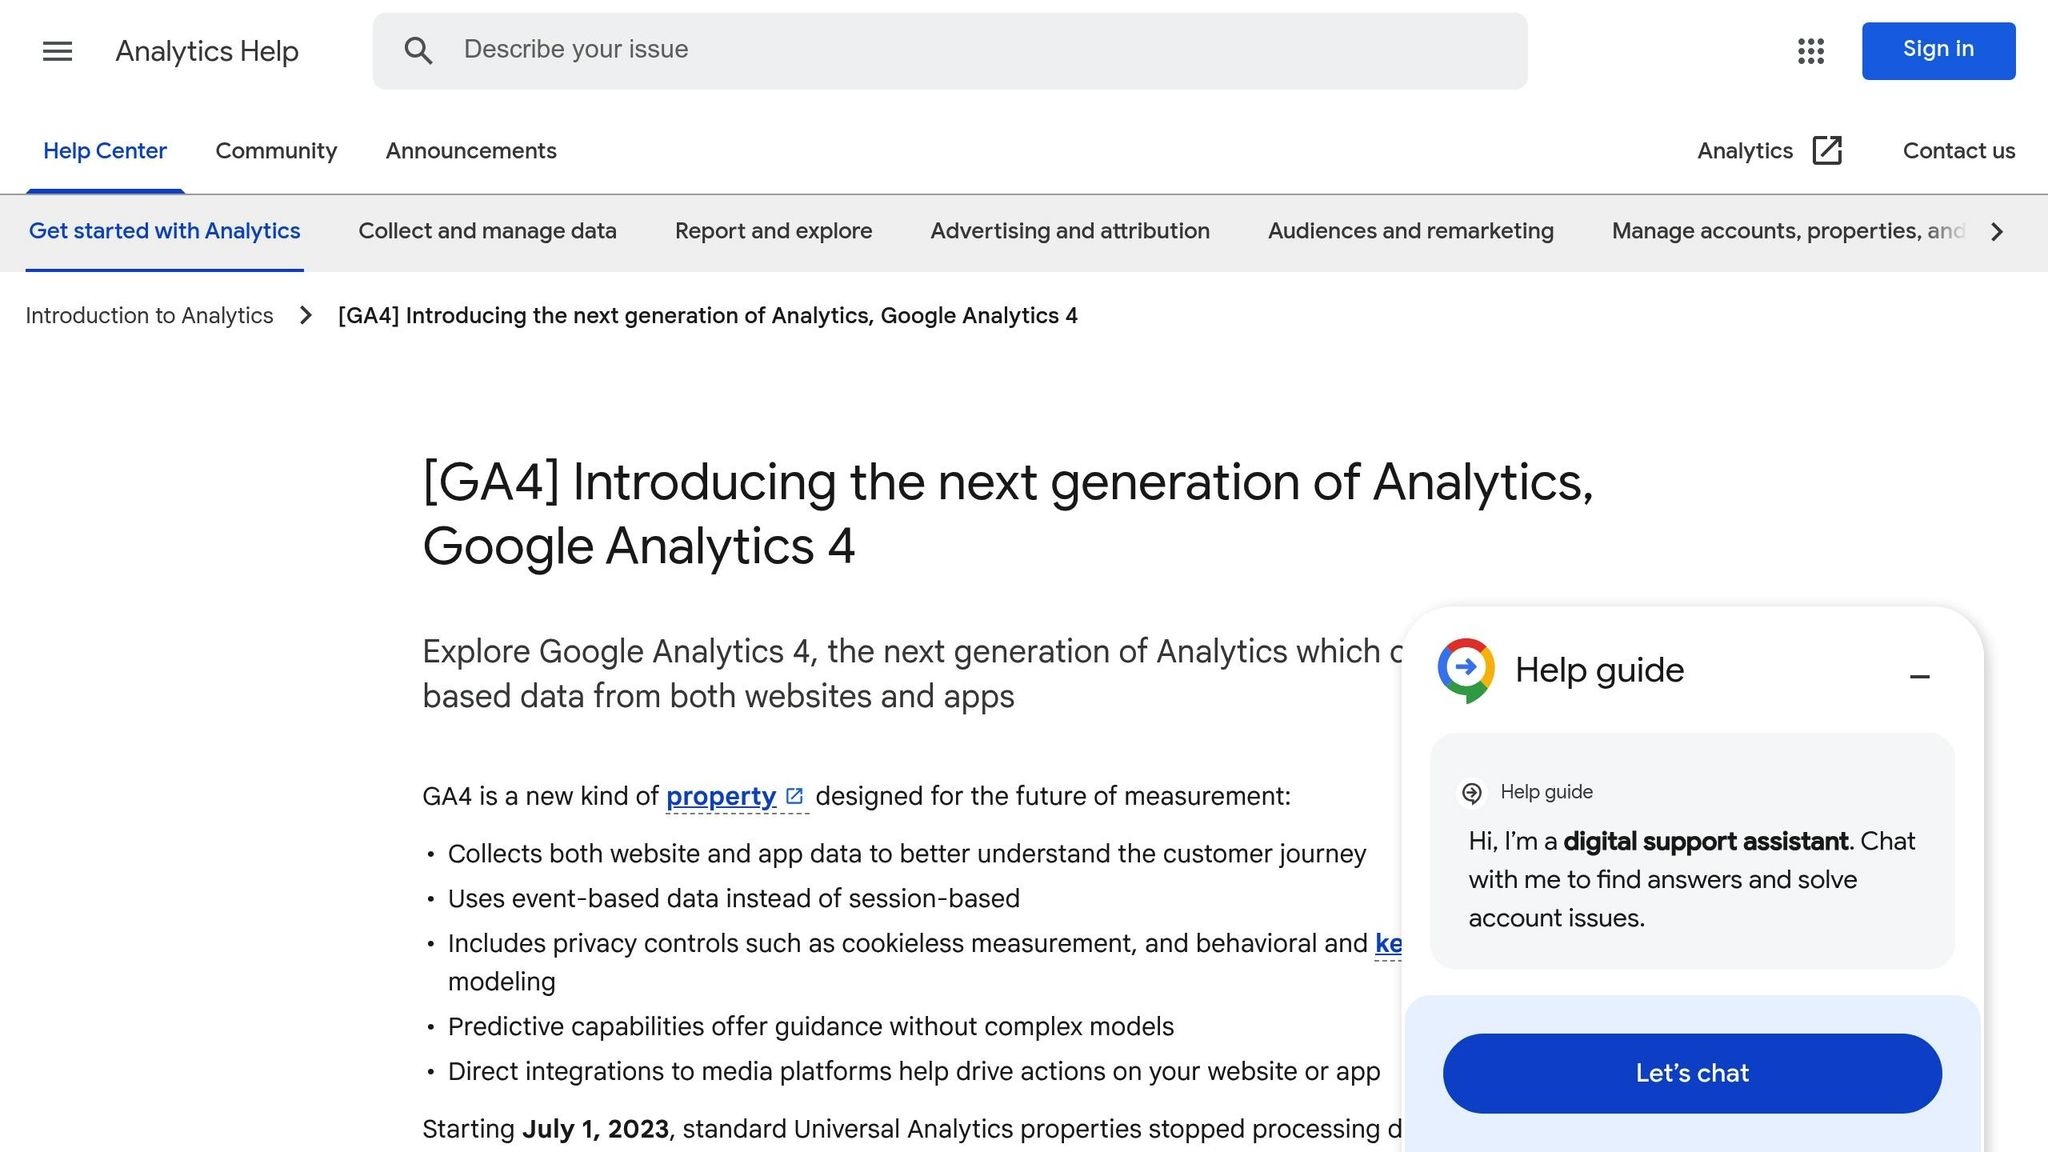
Google Analytics 4 (GA4) is a solid choice for tracking how customers interact with your digital platforms. Its event-focused approach provides detailed insights into user behaviour.
Key GA4 features to set up include:
Automatic event tracking: Captures pageviews, scrolls, and site searches without extra coding.
Custom event tracking: Allows you to monitor actions tied to your specific business objectives.
User reports: Offers demographic and behaviour insights about your audience.
Conversion tracking: Measures success metrics like purchases or sign-ups.
Once configured, integrate the necessary tracking codes across your website to start collecting data.
Install Tracking Codes
Follow these steps to ensure an effective tracking setup:
Set Up Google Tag Manager (GTM)
Add the GTM container code to your website's header. This simplifies and centralises your tracking configurations.
Enable Cross-Domain Tracking
If your website spans multiple domains, adjust your GA4 property settings by adding the measurement ID and a list of domains to track seamlessly across them.
Activate User ID Tracking
Track users across devices and sessions by implementing these steps:
Configuration Step
Implementation Details
Data Layer Setup
Add a user ID variable to the
dataLayer.GTM Configuration
Create a user ID variable inside GTM.
GA4 Settings
Enable the User ID feature in the GA4 admin panel.
Verification
Test the setup using GA4 DebugView.
Track Key Events
Once the tracking codes are in place, focus on capturing crucial user interactions.
Key events to track include:
Event Category | Events to Monitor | Properties to Include |
|---|---|---|
User Journey | Page views, Button clicks | Page name, Click location |
Engagement | Form submissions, Downloads | Form ID, File type |
Conversion | Purchases, Sign-ups | Transaction value, User type |
To get the most out of your tracking:
Use clear, consistent event names.
Document all custom events for easy reference.
Verify your setup using GA4 DebugView.
Review and update your tracking setup every quarter to ensure accuracy and relevance.
Map and Display Customer Journeys
Document Current Journeys
Start by mapping out how customers interact with your brand at every stage. This helps pinpoint user behaviour trends and areas where they might face challenges.
Gather data from various sources, such as:
CRM records: Track customer details and interactions.
Customer feedback: Understand their experiences directly.
Sales team input: Gain insights from those on the front lines.
Website analytics: Monitor online behaviour and engagement.
Support tickets: Identify recurring issues or pain points.
Organise customer journeys into clear stages using the AIDA framework:
Journey Stage | Key Actions to Track | Metrics to Monitor |
|---|---|---|
Awareness | Page views, social engagement | Time on site, bounce rate |
Interest | Case study downloads, blog reads | Return visits, scroll depth |
Desire | Product demos, pricing views | Demo completion rate |
Action | Form submissions, purchases | Conversion rate |
Retention | Return visits, repeat purchases | Customer lifetime value |
Pay close attention to areas where customers drop off or face challenges. For instance, a B2B automation company noticed a significant 45% drop-off after the second follow-up email. The issue? Their emails lacked clear ROI examples, which deterred potential clients.
Once you've documented these journeys, visualise them to better understand how users navigate your offerings.
Build Journey Visualisations
Transform the data you've collected into visual diagrams to highlight user paths and behaviours.
Designing Clear Flow Diagrams
Incorporate these elements to create effective visualisations:
Element | Purpose | Implementation |
|---|---|---|
Colour Schemes | Differentiate user segments | Assign consistent colours for each journey stage |
Line Thickness | Indicate traffic volume | Use thicker lines for more popular paths |
Page Paths | Show user movement | Connect pages based on actual flow |
Drop-off Points | Highlight problem areas | Clearly mark where users exit the journey |
Once the visualisation is ready, use tools like Google Analytics 4 and BigQuery to support your analysis.
Analysing Journeys with BigQuery
Extract page path data from Google Analytics 4.
Process the data to identify common user paths.
Create Sankey diagrams to visualise user flow.
Add relevant metrics for each journey stage to provide deeper insights.
Tips for Effective Journey Mapping
Regularly update maps to reflect changes in user behaviour.
Include both direct and indirect customer interactions.
Track completion rates for each stage of the journey.
Use sequence segments to analyse specific user paths in detail.
Define and monitor custom metrics for each stage to identify unique trends.
Improve Customer Journeys
Find Areas to Improve
Dive into customer journey data to uncover areas for improvement. Focus on these key metrics:
Metric | Benchmark | What to Watch For |
|---|---|---|
Bounce Rate | 26% to 40% optimal | Pages exceeding 40% might need a content review |
Email Open Rate | 21.33% average | Below-average rates could indicate messaging problems |
Cross-Channel Engagement | Varies by industry | Low interaction across multiple channels |
Customer Support Interactions | Channel-specific | Repeated issues or common complaints |
Session Analytics | User-dependent | Signs like rage clicks or form abandonment |
For example, if you notice frequent support tickets or a high bounce rate, it could point to usability problems. Use these insights to guide targeted adjustments.
Make Changes
Once you've identified the weak spots, focus on these areas for improvement:
Cross-Channel Integration: Use localised member data to personalise inventory, events, and promotions. Incorporate in-store QR codes to connect physical and digital experiences, encouraging app engagement.
Content Updates: Research shows that better cross-platform engagement can increase spending. Refine your content strategy to encourage interactions across multiple channels.
Personalisation: Study the habits of loyal customers to identify high-value behaviours. Build campaigns that focus on engaging these actions to drive better results.
Measure Results
Track the impact of your changes by monitoring the following metrics:
Metric Category | What to Track | Signs of Success |
|---|---|---|
Engagement | Time on site, page views | Longer session durations |
Conversion | Form completions, purchases | Higher conversion rates |
Customer Value | Average order value, purchase frequency | Growth in customer lifetime value |
Support | Ticket volume, resolution time | Fewer support queries and faster resolutions |
"Documents that visually illustrate customers' processes, needs, and perceptions throughout their relationships with a company." - Forrester Research
Keep an eye on these metrics regularly. This ongoing analysis will help you understand which changes are working best, ensuring continuous improvements that enhance customer satisfaction and drive business results.
Next Steps
With your tracking system in place and customer journeys mapped out, it’s time to refine your strategy and ensure everything runs smoothly.
Main Points Review
Here’s a quick overview of the key phases to keep your tracking setup on track:
Phase | Key Actions | Expected Outcome |
|---|---|---|
Planning | Define business goals and KPIs | Clear framework for success |
Analysis | Map website/app structure | Detailed tracking plan |
Implementation | Set up analytics tools | Fully functional system |
Optimisation | Monitor and make adjustments | Better data accuracy |
Make sure to connect user actions directly to your business goals. This will help you turn data into insights you can act on.
Work with Dolphin Analytics

If you want to take your tracking efforts further, Dolphin Analytics offers tailored solutions designed to deliver results. For example, one of our automotive clients achieved a 67% boost in sign-up completions after working with us.
Here’s what we bring to the table:
Customised Implementation: We design analytics solutions that match your business needs, so you can focus on tracking what matters most.
Data Integration Expertise: From data engineering to visualisation, we cover the entire analytics stack to ensure seamless integration.
Ongoing Support: Regular check-ins and support sessions keep your data accurate and your strategy on point.
"Data can be complex and more often, it is made unnecessarily so by the people within it, however Dolphin Analytics' skill is in understanding what's possible, what's necessary and making that easily understood and implemented. It's rare to have such consistently good and reliable data expertise but Dolphin Analytics always delivers!" - Dino Myers-Lamptey, MD - MullenLowe Mediahub
Our services start at £75 per hour for Standard support, with Express options at £99 per hour. Comprehensive setups begin at £999 and can scale to meet enterprise-level requirements.
Book a consultation today and take the next step towards optimising your digital presence.
FAQs
How can I make sure my customer journey tracking supports my business goals?
To ensure your customer journey tracking aligns with your business goals, start by identifying the key touchpoints where customers interact with your brand. Gather data from multiple sources, such as website analytics, customer feedback surveys, and social media activity, to build a complete picture of the customer experience.
Next, map out the customer journey and create detailed user personas to understand their actions, motivations, and pain points. Use analytics tools to monitor behaviour patterns, identify trends, and uncover areas for improvement. By focusing on the insights that directly impact your objectives, you can make data-driven decisions to optimise the customer experience and drive growth.
How can I personalise customer experiences using data from journey tracking?
To personalise customer experiences effectively, start by analysing the data collected from journey tracking to understand behaviours and preferences across key touchpoints. This insight allows you to create tailored content, offers, and interactions that resonate with your audience.
Focus on mapping the customer journey to identify patterns and opportunities for improvement. Use this information to address pain points, enhance user satisfaction, and deliver experiences that feel relevant and meaningful. By acting on these insights, you can build stronger relationships with your customers and drive long-term growth.
How often should I review and update my customer journey tracking setup?
To maintain the effectiveness and accuracy of your customer journey tracking, it's essential to review and update your setup regularly. While there’s no universal rule, a good practice is to reassess it at least every quarter or whenever significant changes occur in your business, such as launching new campaigns, updating your website, or introducing new products or services.
Frequent reviews ensure your tracking reflects current customer behaviours and business goals, helping you make data-driven decisions and optimise your marketing efforts. Adjustments may also be necessary as you gather more data and identify new opportunities for improvement.
Related posts
7 Essential Google Analytics 4 Metrics for SMBs in 2025
Common Analytics Implementation Issues and Solutions
Marketing Attribution Models: A Beginner's Guide